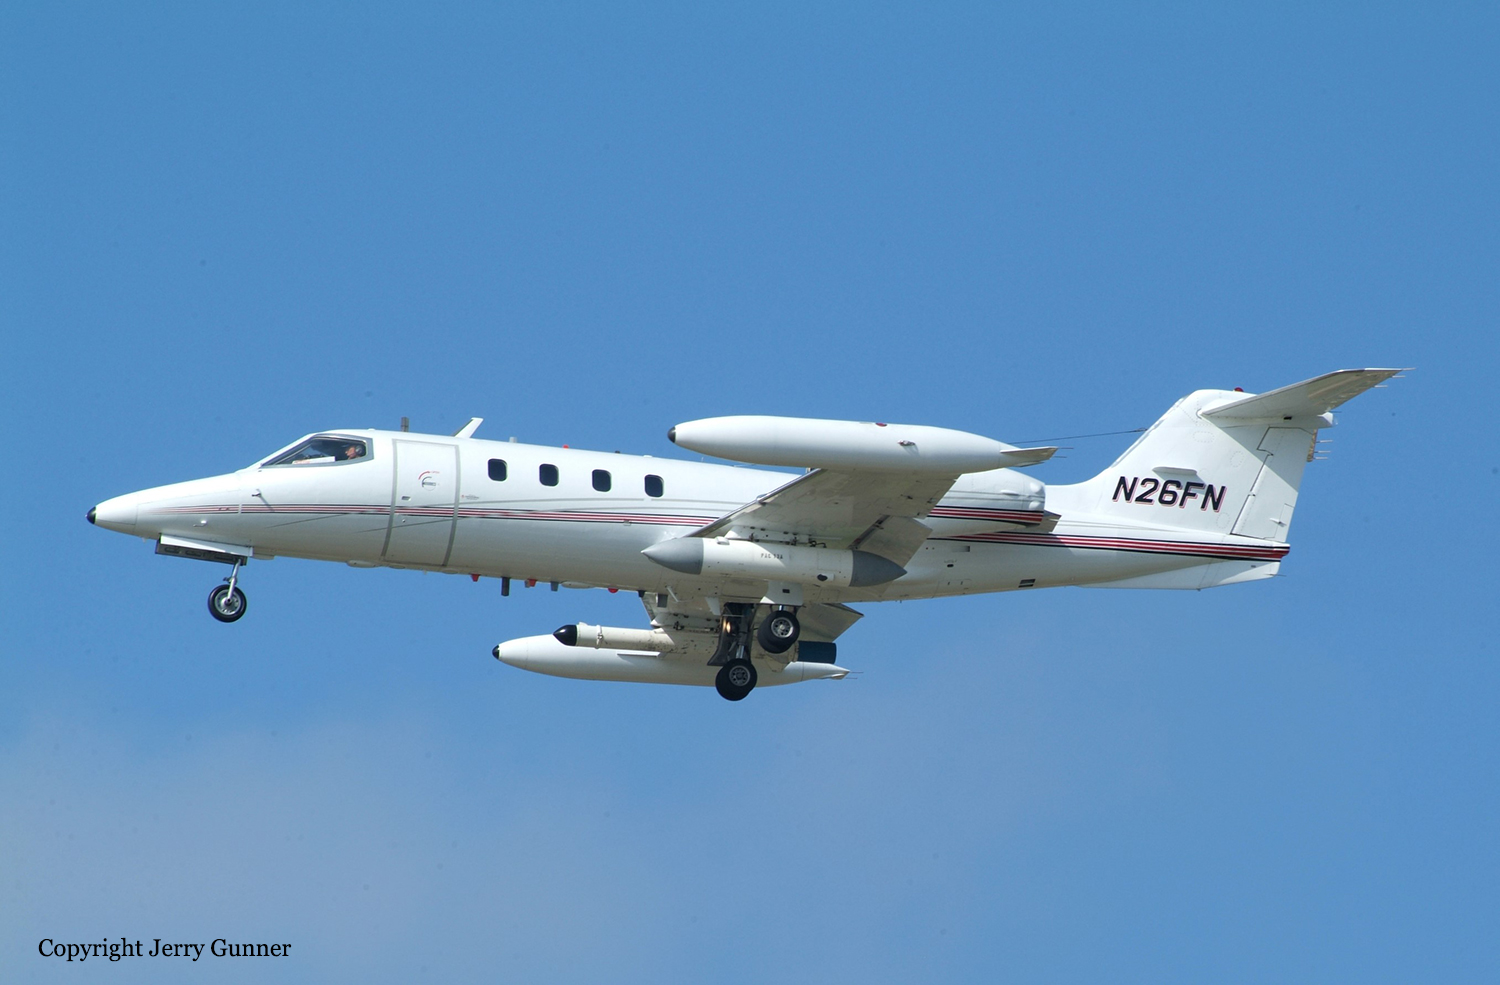
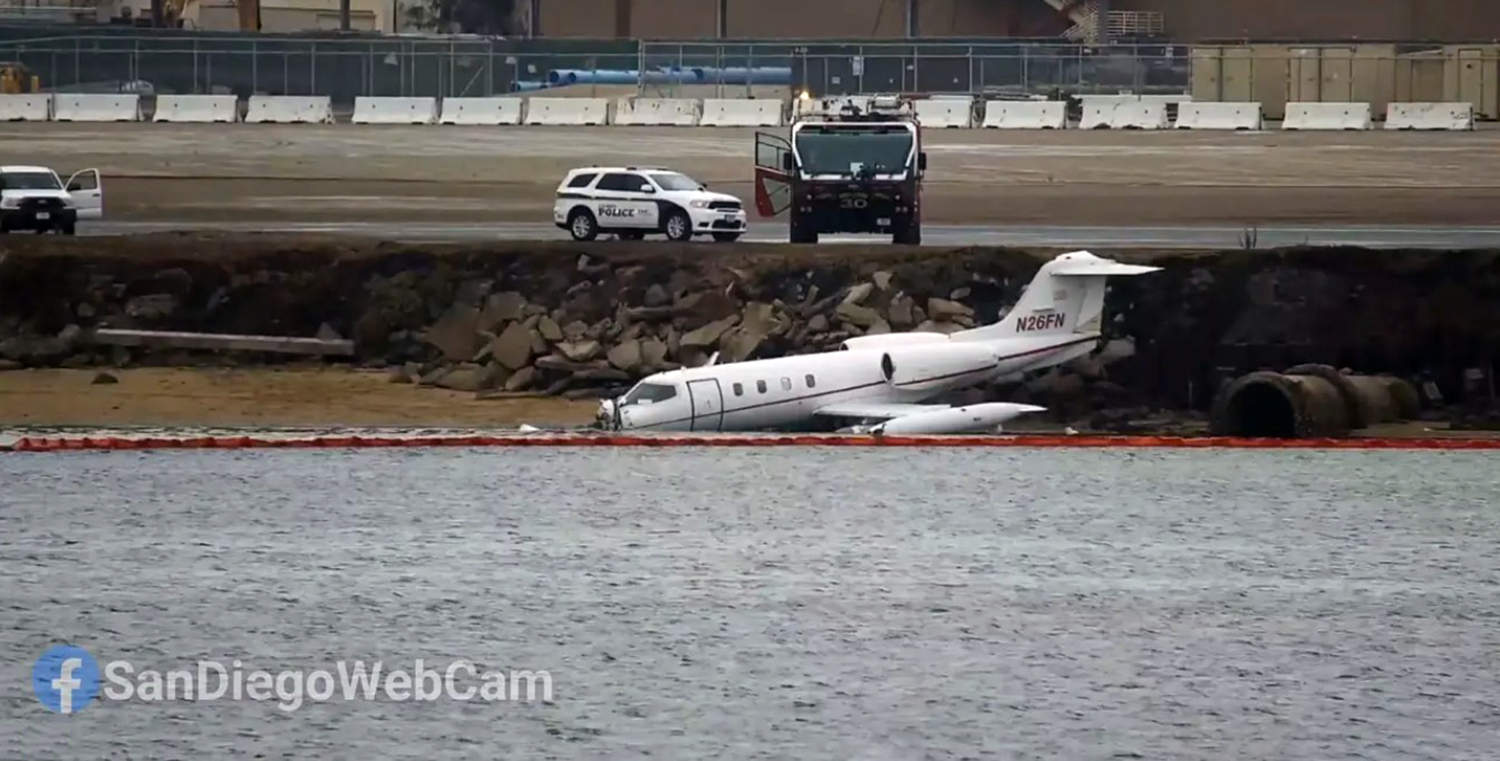
Crash of a Learjet 36 at North Island NAS
Date & Time:
Sep 9, 2022 at 1314 LT
Registration:
N26FN
Survivors:
Yes
Schedule:
North Island - North Island
MSN:
36-011
YOM:
1975
Flight number:
FST26
Crew on board:
2
Crew fatalities:
Pax on board:
0
Pax fatalities:
Other fatalities:
Total fatalities:
0
Captain / Total hours on type:
5250.00
Copilot / Total hours on type:
165
Aircraft flight hours:
17024
Circumstances:
The flight crew was supporting a United States Navy (USN) training mission and ended the flight early due to icing conditions. The flight crew calculated a landing reference speed (Vref) of 140 knots (kts) indicated airspeed (KIAS) and landing distance required of 4,200 ft for a wet runway and a flap setting of 20°. Due to underwing-mounted external storage, the landing flaps were limited to a maximum extension of 20°. The flight crew configured the airplane with 20° flaps and reported that the airplane touched down at 140 kts. Although the runway was 8,001 ft long, an arresting cable was located 1,701 ft from the runway threshold, resulting in a runway distance available of about 6,300 ft. After landing, the second in command (SIC) reported that the pilot-in-command (PIC) deployed the spoilers and brakes, then announced that the airplane was not slowing down. The PIC stated that the airplane did not decelerate normally, that the brake anti-skid system was active, and that the airplane seemed to be hydroplaning. He cycled the brakes, which had no effect.The airplane subsequently overran the departure end of the runway, breached an ocean sea wall and came to rest in a nose-down attitude on a sandbar. The airport weather observation system recorded that 0.06 inches of liquid equivalent precipitation fell between 18 and 9 minutes before the accident. In the 4 hours before the accident, the airport received 0.31 inches of liquid equivalent precipitation. A landing performance study conducted by the airplane manufacturer modeled a variety of landing scenarios considered during the investigation. The modeling used factual information provided by the investigation, including ADS-B data, as well as manufacturer-provided airplane performance data specific to the airplane. The study considered the effect on landing distance of both a wet and dry runway, a contaminated runway, both full and intermittent hydroplaning, a localized tailwind (which was not present in the weather data), and an inboard brake failure. The study showed that the most likely scenario, based on the available data, was that the airplane touched down with a ground speed well in excess of the 140 kts Vref speed reported by the crew, and that subsequent to the touchdown encountered full hydroplaning at speeds above 104 kts. The airplane sat overnight on the sandbar and was submerged in saltwater before the airplane was recovered. As a result, the airplane’s braking system could not be functionally tested. However, the physical evidence from the brakes as found post accident, combined with the results of the landing distance modeling, did not indicate that a brake failure occurred. Similarly, ADS-B data did not support the presence of a localized tailwind when such a landing was modeled in the study. Thus, it’s likely that the flight crew landed too fast and then encountered hydroplaning during the landing roll as a result of a recent heavy rain shower, which diminished the calculated stopping distance.
Probable cause:
The flight crew’s fast landing on a wet runway, which resulted in the airplane hydroplaning during the landing roll and subsequently overrunning the runway.
Final Report:

